How The Data Forest supported Mondelez’s data-driven sales culture

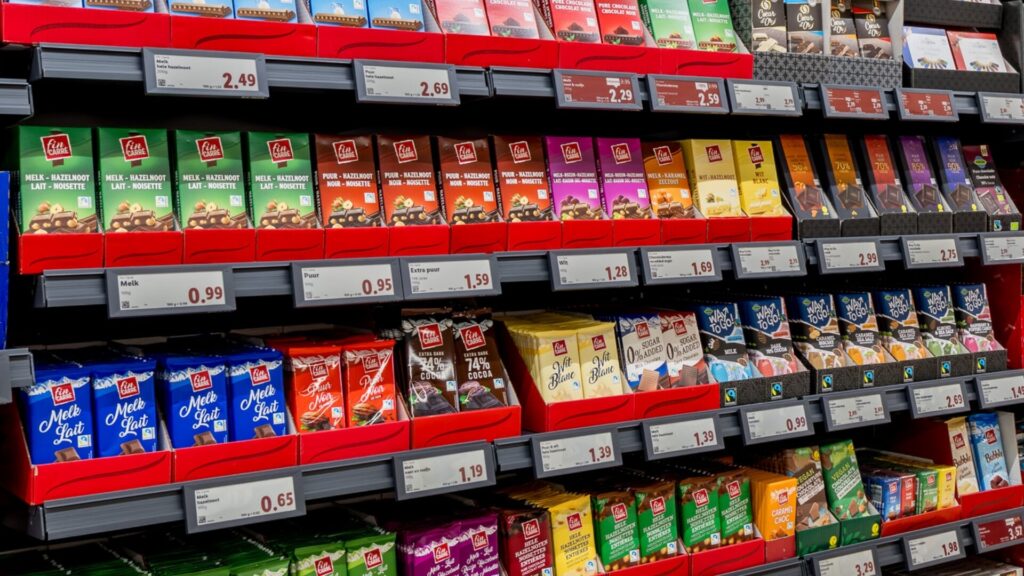
Supermarket shelves with packaged consumer goods
March 9, 2026

About the client

Mondelez International is one of the world’s largest snacking companies, home to iconic brands including Côte d’Or, Milka, Oreo, and Belvita. In Benelux, the sales and marketing team relies on large volumes of retail and market data to drive business decisions and support their retail & OOH partners.

The challenge

Mondelez has access to rich Nielsen market data and used to derive insights via static reports. The BNL Data & Analytics team wanted to upgrade their visualization practices by building user-friendly reports and following a storyline approach. The goal was to enable the commercial team to easily navigate, smoothly analyze business challenges, and improve the speed to insights. A real funnel approach, from high-level to more in-depth analyses. Mondelez needed to move fast. They required external expertise, not just to build dashboards, but to support their team, align on the right questions, and kick-start a new analytical journey focused on funnel analysis. How do you create dashboards that support the commercial selling story? How do you make your data talk?

Our approach

The Data Forest took a structured, human-first approach, starting with people and process before touching any data or tools.

1. Data storytelling training

We kicked off the project with a data storytelling training session for the Mondelez team. The goal was to build a shared language around data and visualization: what makes a good dashboard, how to frame insights as stories, and how to think about the needs of the end user. What is the question behind the question? This upfront investment paid dividends throughout the entire project.

2. Dashboard design workshop

Before building a single dashboard, we ran a co-creation workshop directly with some key users. Together, we:
  • Mapped the user journeys: who needs what, when, and why.
  • Identified the key KPIs that really matter to the business.
  • Created wireframes, sketching the layout and content of each dashboard before any development began.
  • Kept asking: why, why, why?
This approach ensured that when the build started, the dashboards served a clear purpose and had buy-in from the people who would actually use them.

3. Dashboard development

With a solid blueprint in place, we started the co-creation with the Mondelez D&A team.

Specific challenges we solved

  • Speed to value: Mondelez needed results quickly. One of our key strengths is the ability to rapidly scale up resources for short-term assignments. We deployed the right profile fast, without the usual lead times of a traditional consulting engagement.
  • Adding seniority to the team: By embedding an experienced BI consultant within the Mondelez team, we could share best practices in dashboard design and upgrade the storytelling.

Results and benefits

  • Category managers and sales teams now have dashboards that reflect their actual workflows and KPIs. Built with them, not just for them.
  • The ongoing culture shift towards data-driven decision-making has been supported by a shared vocabulary, clean visuals, and accessible insights.
  • Thanks to our flexible engagement model, Mondelez got the senior expertise they needed exactly when they needed it, without a long commitment.

Used tools

Microsoft Power BI
Microsoft Fabric

Does it sound familiar?

We’d love to explore how we can support you.

Trusted by forward-thinking companies worldwide