Turning market research data into an interactive dashboard

The Data Forest
May 4, 2026

About Dataminded

Dataminded is a Belgian data engineering consultancy that helps companies build and scale modern data platforms. At the beginning of 2025, they conducted an extensive market research study, The State of European Data Work in 2025, surveying 151 data professionals across Europe. The goal of the project was to give back to the data community by making key findings publicly accessible through an interactive dashboard.

The challenge

Dataminded had rich survey data covering data challenges, team structures, tool preferences, and priorities across European companies. They had no way to make it explorable for a broad audience. The data posed specific requirements:
  • The dashboard needed to be publicly accessible on the web, so anyone in the data community could explore the findings.
  • The dashboard needed to present the key insights in a narrative format, but also allow for data exploration where users could freely filter and slice the data across multiple dimensions.
  • Dataminded wanted to maintain full ownership over the tech stack and data, with the ability to integrate lead generation tooling and web analytics on their side.
Dataminded needed a partner who could move fast, think visually, and deliver a polished data product. Not just a set of charts, but a storytelling experience.

Our approach

The Data Forest took a structured approach, combining data storytelling expertise with technical delivery to create a dashboard that truly communicates.

1. Understanding the data and the story

We started by immersing ourselves in the research findings. Working closely with the Dataminded team, we explored the key insights that deserved the spotlight. This exploration shaped the entire dashboard structure.

2. Designing the dashboard experience

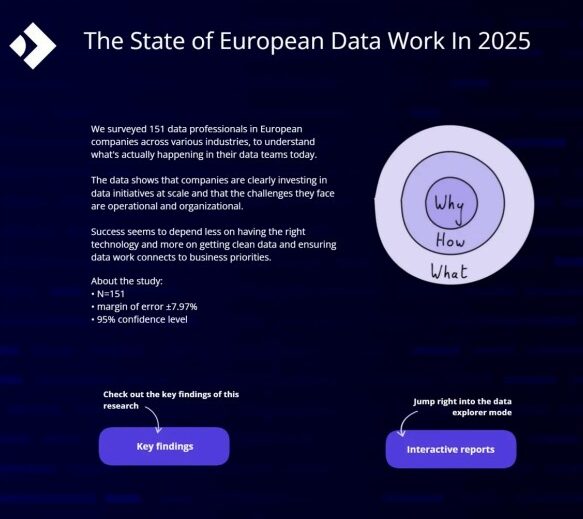
Rather than building a generic chart collection, we designed two deliberate user journeys. The Key Findings mode guides visitors through a curated narrative with supporting visualisations, making the research accessible to anyone, regardless of technical background. The Interactive Reports mode provides a data explorer where users can filter across dimensions like company industry, company size, and job profile to find the insights most relevant to them. Customer Case: Mondelezthedataforest.be The Data Forest | Creating insights – Serving nature

3. Building on Dataminded’s stack

We built the dashboard in Looker, connected to BigQuery for data storage. A stack we chose so Dataminded retained full ownership. The final product could easily be embedded as an iframe on their website, giving them complete control over the display layer, including web analytics and lead generation via HubSpot.

Specific challenges we solved

  • Storytelling in a BI tool: We pushed Looker beyond its typical use case, creating a story mode with narrative text, curated visualisations, and a guided flow that feels more like a report than a dashboard.
  • Public access without friction: The dashboard needed to be open to anyone on the internet without Looker accounts. With looker, the solution supported public embedding while keeping Dataminded’s data and infrastructure secure.
  • Brand-consistent design: Using Dataminded’s brand assets, we ensured the dashboard felt like a natural extension of their website, not a generic BI embed.
  • Speed to delivery: From kick-off to a polished, public-facing dashboard in weeks, meeting the tight timeline without cutting corners on quality or user experience.

Results and benefits

  • Dataminded now has a public-facing, interactive dashboard that positions them as a thought leader in the European data community. backed by real research, not opinions.
  • The dual story/explorer mode makes the research accessible to both casual visitors and data professionals who want to dig deeper.
  • The dashboard serves as a lead generation asset, driving traffic and email sign-ups through Dataminded’s own tooling.
  • Full ownership of the stack (BigQuery + Looker) means Dataminded can update, extend, and maintain the dashboard independently going forward.

Used tools

Does it sound familiar?

We’d love to explore how we can support you.

Trusted by forward-thinking companies worldwide